
If you thought that hackers were taking a break over the last year or so, this interactive graphic will have you rethinking that opinion.
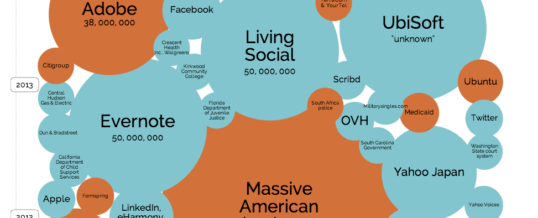
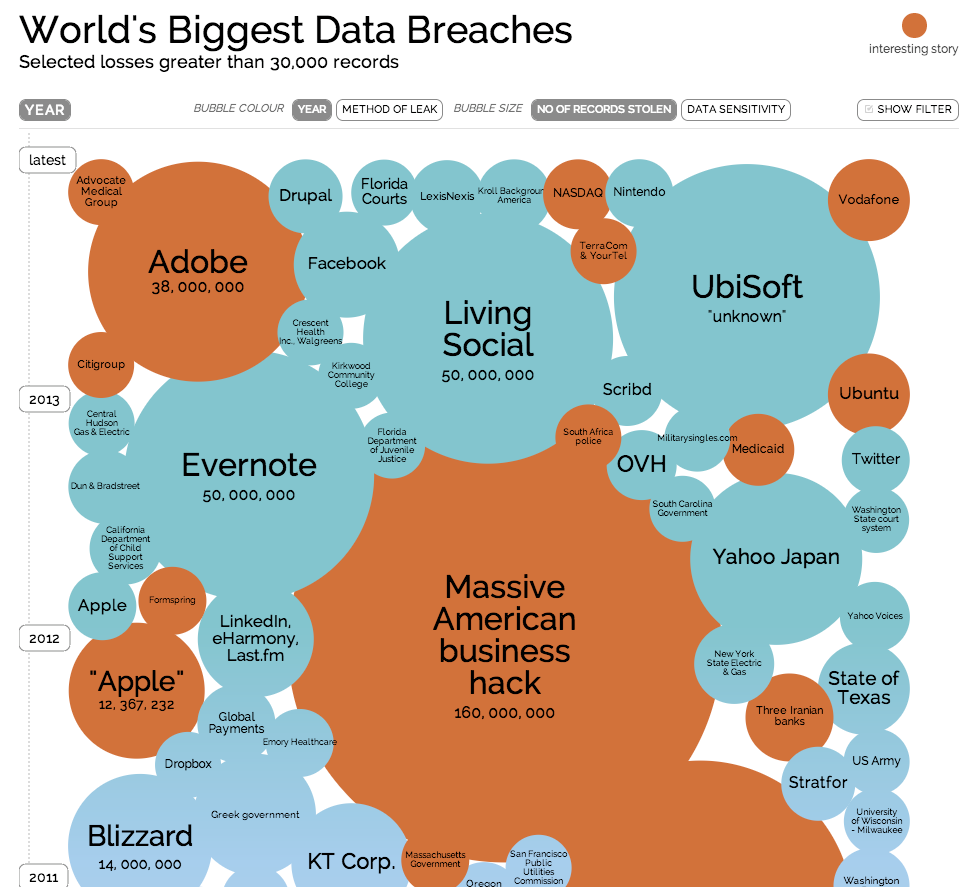
David McCandless of Information is Beautiful created the graphic with coder Tom Evans. It shows All the data breaches over the last 9 years and the number of records hacked. Each attack is displayed as a bubble, based on that victim-count. They’ve included a slick filtering tool as well which allows you to filter by organization type and order by year and the method of leak.
Check out the interactive infographic and let us know if you still think Identity Theft isn’t the #1 industry in the US.